


Decades of water conservation campaigns, advances in water efficiency technologies, and adoption of conservation-oriented rate structures have led to an uncomfortable new normal where water service providers can’t sell enough water to offset the costs of providing service. This is referred to as a “conservation conundrum”, or the need to remain solvent while advocating for conservation and considering customer equity. The intuitive strategy for addressing shortfalls in water sales revenue is to raise the prices, or rates, for the water sold. However, if customers are sensitive to price, then this approach may consistently come up short. Quantifying the level of price sensitivity is therefore an important step in beginning to address the issue.
Access the full 2026 Q3 Water Market Insider
Enter your email to read the latest issue – you’ll also receive our quarterly publication featuring water market news, insights, and announcements.
PRICE ELASTICITY OF DEMAND
A rational consumer is often observed to make purchasing choices that are influenced by price; if the price of a good decreases, they will demand more, and if the price increases, they will demand less. But how strongly consumers respond to a price change varies across goods. For luxury goods, such as electronics, branded clothing or organic food, small price changes can cause large swings in demand. For staple goods, like table salt, gasoline, or utilities, demand doesn’t change very much, if at all. This concept – how sensitive quantity demanded is to a change in price – is referred to as the Price Elasticity of Demand (PED). An elastic good is one where demand is highly responsive to price changes, while an inelastic good is one where demand is relatively unresponsive to price changes. PED is calculated by dividing the percent change in demand by the percent change in price. If the value of PED is equal to one, a 1% change in price will cause exactly a 1% change in the quantity demanded, demonstrating unit elasticity. For most goods, price and demand are inversely related, resulting in a negative PED

RESIDENTIAL WATER: ELASTIC OR INELASTIC?
Household-level water demand has traditionally been characterized as strongly inelastic because it is an everyday necessity. However, household water may also be used for optional activities like filling a swimming pool, watering a garden, or washing a car, which can fall under the moderately inelastic category. Whether consumers are aware of it or not, the concept of PED is at play when rates change and customers respond.
Academics have long studied PED as it relates to municipal water use, and the overwhelming conclusion from past work has been that municipal water demand is inelastic, i.e., customers do not respond strongly to price changes. Until recently, industry has followed suit by omitting the consideration of PED when establishing water rates. However, recent studies taking a more granular approach have found that certain population subsets do indeed show price sensitivity. Further, modeling conducted by WestWater demonstrates that a customer base characterized as moderately inelastic can generate significant revenue shortfalls for a water service provider in just a few years.
WATER RATES
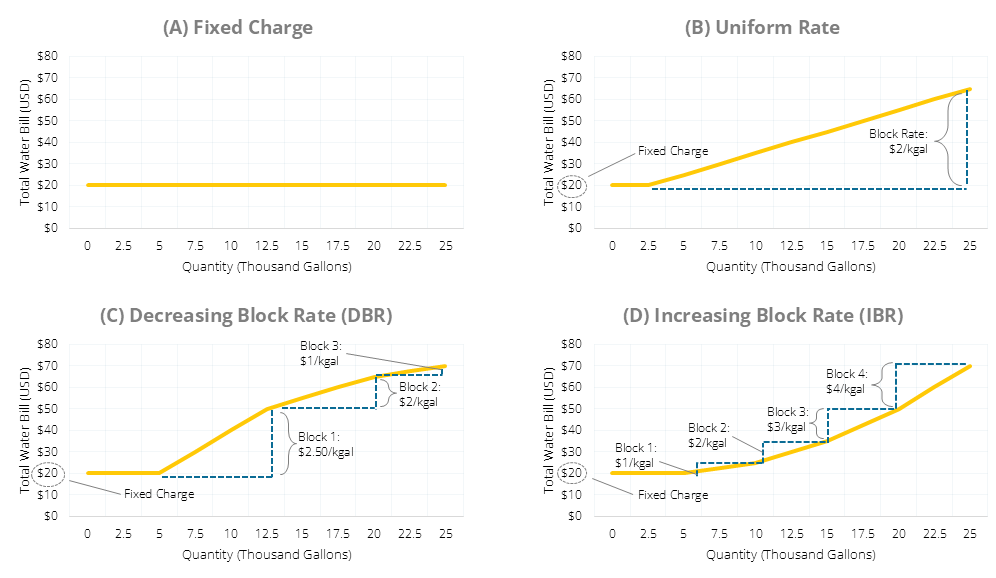
There are several strategies for charging customers for potable water, with common rate structures depicted in Figure 1. Most providers in the Western U.S. today adhere to one main umbrella structure: an increasing block rate (IBR) structure. An IBR structure generally consists of a fixed monthly charge paired with multiple blocks, where each successive block will have a marginally higher volumetric rate.
Figure 1: Forms of Water Rate Structures
THE CONSERVATION CONUNDRUM CYCLE
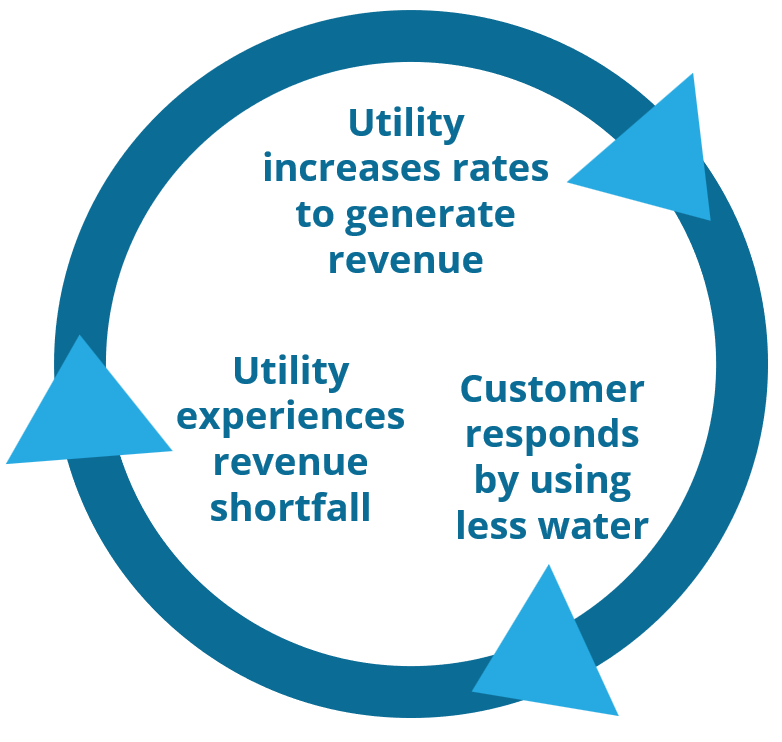
When setting rates, water service providers must consider how the prices they assign will influence their customers. The water utility might consider several factors during this process and is thus challenged with prioritizing some over others. Common competing factors are conservation and revenue sufficiency; when customers are more conservative, the utility generates less revenue, and when the utility generates less revenue, they are inclined to increases prices, which may influence customers to consume even less. This cyclical phenomenon is referred to as the “conservation conundrum”.

BRIDGING THE GAP – CONSERVATION AND REVENUE SUFFICIENCY
Municipal water conservation may generate both positive and negative outcomes for a municipal water service provider. An example positive outcome is the postponement of system expansion or infrastructure maintenance attributable to increased water demands, whereas an example negative outcome is the reduction in water sales revenue that a service provider needs to support its annual revenue requirement. Shortfalls in water sales revenue can result in volatile short-term rate adjustments that present serious cost recovery and political challenges to water service providers.
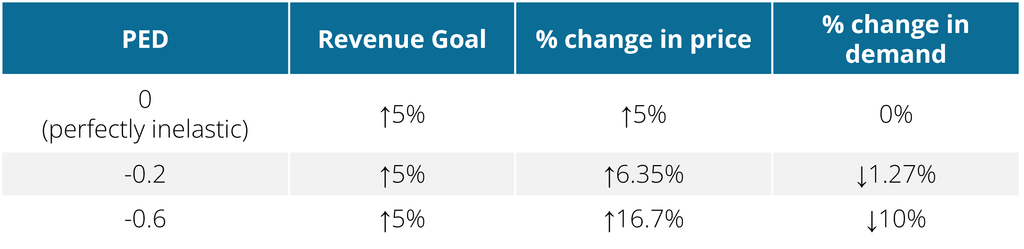
A common strategy employed by water service providers to address these challenges is raising rates for all customer classes. However, this basic rate adjustment strategy does not account for price sensitivities that exist for the customer base, so revenues are prone to falling short of their targets. For instance, if a water service provider needs to raise revenue by 5%, the intuitive strategy is to raise rates by 5%. However, assuming a PED for municipal water of -0.2, the planned 5% increase in rates will only yield an increase in revenue of approximately 4%. To account for price sensitivities, rates would need to increase by about 6.35%. Thus, a water service provider can proactively prepare for the challenges associated with conservation and revenue sufficiency by ensuring it has a firm understanding of the price sensitivities that exist throughout its customer base.
LOOKING AHEAD
Water providers in the Western US are facing a fundamental challenge: per-capita consumption continues to decline, even as population growth pushes total demand and infrastructure needs higher. This dynamic puts pressure on the link between rates and revenue. Incorporating PED allows providers to anticipate how customers will respond to rate changes, rather than reacting after revenue falls short of targets. Common cost recovery strategies include increasing base charges and differentiated volumetric rate increases across blocks. More creatively, some providers may implement seasonal increases or charges based on property characteristics. Rate adjustments that incorporate elasticity are better positioned to deliver predictable revenue while minimizing customer concern that can accompany steep or unexpected rate increases.
As efficiency gains continue to reshape demand, providers that build PED into their rate-setting process will be better equipped to fund infrastructure needs without overcorrecting on price.
FURTHER READING
- CBS News Article: December 2025. Northern Colorado town to increase water and sewage rates 26% in 2026.
- Circle of Blue: June 2019. Price of Water 2019: Even Without Federal Infrastructure Deal, Cities Continue to Invest
- Texas Living Waters: February 2014: Designing Water Rate Structures for Conservation & Revenue Stability
CONTACT THE AUTHOR
Savanna Craig
Analyst
Colorado Office (970) 851-0657
craig@westwaterresearch.com

HOW WESTWATER CAN HELP
PED is a valuable indicator for municipal water service providers for understanding their customers’ sensitivity to changes in price. Equipped with this understanding, providers can make more informed rate adjustments that support both revenue and political goals. WestWater Research consults with municipal water service providers on a myriad of planning and operational topics. PED is a natural complement to these services. Contact us to discuss how PED analysis can inform your rate-setting process and support long-term financial and political stability.
